A1: Counts

Code Replication

taxi <- read_csv("https://vincentarelbundock.github.io/Rdatasets/csv/modeldata/taxi.csv")
Rows: 10000 Columns: 8
── Column specification ────────────────────────────────────────────────────────
Delimiter: ","
chr (5): tip, company, local, dow, month
dbl (3): rownames, distance, hour

ℹ Use `spec()` to retrieve the full column specification for this data.
ℹ Specify the column types or set `show_col_types = FALSE` to quiet this message.
taxi
# A tibble: 10,000 × 8
   rownames tip   distance company                      local dow   month  hour
      <dbl> <chr>    <dbl> <chr>                        <chr> <chr> <chr> <dbl>
 1        1 yes      17.2  Chicago Independents         no    Thu   Feb      16
 2        2 yes       0.88 City Service                 yes   Thu   Mar       8
 3        3 yes      18.1  other                        no    Mon   Feb      18
 4        4 yes      20.7  Chicago Independents         no    Mon   Apr       8
 5        5 yes      12.2  Chicago Independents         no    Sun   Mar      21
 6        6 yes       0.94 Sun Taxi                     yes   Sat   Apr      23
 7        7 yes      17.5  Flash Cab                    no    Fri   Mar      12
 8        8 yes      17.7  other                        no    Sun   Jan       6
 9        9 yes       1.85 Taxicab Insurance Agency Llc no    Fri   Apr      12
10       10 yes       1.47 City Service                 no    Tue   Mar      14
# ℹ 9,990 more rows
glimpse(taxi)
Rows: 10,000
Columns: 8
$ rownames <dbl> 1, 2, 3, 4, 5, 6, 7, 8, 9, 10, 11, 12, 13, 14, 15, 16, 17, 18…
$ tip      <chr> "yes", "yes", "yes", "yes", "yes", "yes", "yes", "yes", "yes"…
$ distance <dbl> 17.19, 0.88, 18.11, 20.70, 12.23, 0.94, 17.47, 17.67, 1.85, 1…
$ company  <chr> "Chicago Independents", "City Service", "other", "Chicago Ind…
$ local    <chr> "no", "yes", "no", "no", "no", "yes", "no", "no", "no", "no",…
$ dow      <chr> "Thu", "Thu", "Mon", "Mon", "Sun", "Sat", "Fri", "Sun", "Fri"…
$ month    <chr> "Feb", "Mar", "Feb", "Apr", "Mar", "Apr", "Mar", "Jan", "Apr"…
$ hour     <dbl> 16, 8, 18, 8, 21, 23, 12, 6, 12, 14, 18, 11, 12, 19, 17, 13, …
inspect(taxi)

categorical variables:  
     name     class levels     n missing
1     tip character      2 10000       0
2 company character      7 10000       0
3   local character      2 10000       0
4     dow character      7 10000       0
5   month character      4 10000       0
                                   distribution
1 yes (92.1%), no (7.9%)                       
2 other (27.1%) ...                            
3 no (81.2%), yes (18.8%)                      
4 Thu (19.6%), Wed (17.5%), Tue (16.3%) ...    
5 Apr (31.8%), Mar (31.4%), Feb (20.4%) ...    

quantitative variables:  
      name   class min      Q1  median        Q3     max        mean
1 rownames numeric   1 2500.75 5000.50 7500.2500 10000.0 5000.500000
2 distance numeric   0    0.94    1.78   15.5625    42.3    6.224144
3     hour numeric   0   11.00   15.00   18.0000    23.0   14.177300
           sd     n missing
1 2886.895680 10000       0
2    7.381397 10000       0
3    4.359904 10000       0
skim(taxi)
Data summary
Name taxi
Number of rows 10000
Number of columns 8
_______________________
Column type frequency:
character 5
numeric 3
________________________
Group variables None

Variable type: character

skim_variable n_missing complete_rate min max empty n_unique whitespace
tip 0 1 2 3 0 2 0
company 0 1 5 28 0 7 0
local 0 1 2 3 0 2 0
dow 0 1 3 3 0 7 0
month 0 1 3 3 0 4 0

Variable type: numeric

skim_variable n_missing complete_rate mean sd p0 p25 p50 p75 p100 hist
rownames 0 1 5000.50 2886.90 1 2500.75 5000.50 7500.25 10000.0 ▇▇▇▇▇
distance 0 1 6.22 7.38 0 0.94 1.78 15.56 42.3 ▇▁▂▁▁
hour 0 1 14.18 4.36 0 11.00 15.00 18.00 23.0 ▁▃▅▇▃
## Convert `dow`, `local`, and `month` into ordered factors
taxi_modified <- taxi %>%
  mutate(
    dow = factor(dow,
      levels = c("Mon", "Tue", "Wed", "Thu", "Fri", "Sat", "Sun"),
      labels = c("Mon", "Tue", "Wed", "Thu", "Fri", "Sat", "Sun"),
      ordered = TRUE
    ),
    ##
    local = factor(local,
      levels = c("no", "yes"),
      labels = c("no", "yes"),
      ordered = TRUE
    ),
    ##
    month = factor(month,
      levels = c("Jan", "Feb", "Mar", "Apr"),
      labels = c("Jan", "Feb", "Mar", "Apr"),
      ordered = TRUE
    )
  )
taxi_modified %>% glimpse()
Rows: 10,000
Columns: 8
$ rownames <dbl> 1, 2, 3, 4, 5, 6, 7, 8, 9, 10, 11, 12, 13, 14, 15, 16, 17, 18…
$ tip      <chr> "yes", "yes", "yes", "yes", "yes", "yes", "yes", "yes", "yes"…
$ distance <dbl> 17.19, 0.88, 18.11, 20.70, 12.23, 0.94, 17.47, 17.67, 1.85, 1…
$ company  <chr> "Chicago Independents", "City Service", "other", "Chicago Ind…
$ local    <ord> no, yes, no, no, no, yes, no, no, no, no, no, no, no, yes, no…
$ dow      <ord> Thu, Thu, Mon, Mon, Sun, Sat, Fri, Sun, Fri, Tue, Tue, Sun, W…
$ month    <ord> Feb, Mar, Feb, Apr, Mar, Apr, Mar, Jan, Apr, Mar, Mar, Apr, A…
$ hour     <dbl> 16, 8, 18, 8, 21, 23, 12, 6, 12, 14, 18, 11, 12, 19, 17, 13, …
gf_bar(~tip, data = taxi_modified) %>%
  gf_labs(title = "Plot 1A: Counts of Tipss")

taxi_modified %>%
  gf_bar(~tip,
    fill = ~local, 
    position = "dodge"
  ) %>%
  gf_labs(title = "Plot 2A: Dodged Bar Chart")

taxi_modified %>%
  gf_bar(~company,
    fill = ~tip,
    position = "fill"
  ) %>%
  gf_labs(title = "Plot 2A: Dodged Bar Chart") %>%
  gf_theme(theme(axis.text.x = element_text(size = 6, angle = 45, hjust = 1)))

gf_bar(~dow, fill = ~tip, position="fill", data = taxi_modified) %>%
  gf_labs(title = "Plot C: Counts of Tips by Day of Week")

gf_bar(~month, fill = ~tip,  data = taxi_modified) %>%
  gf_labs(title = "Plot D: Counts of Tips by Month")

Pokémon

pokemon <- fromJSON("https://calmcode.io/static/data/pokemon.json")


pretty_json <- toJSON(pokemon, pretty = TRUE, auto_unbox = TRUE)


write(pretty_json, file = "pretty_pokemon.json")

Examining

glimpse(pokemon)
Rows: 800
Columns: 5
$ name   <chr> "Bulbasaur", "Ivysaur", "Venusaur", "VenusaurMega Venusaur", "C…
$ type   <list> <"Grass", "Poison">, <"Grass", "Poison">, <"Grass", "Poison">,…
$ total  <int> 318, 405, 525, 625, 309, 405, 534, 634, 634, 314, 405, 530, 630…
$ hp     <int> 45, 60, 80, 80, 39, 58, 78, 78, 78, 44, 59, 79, 79, 45, 50, 60,…
$ attack <int> 49, 62, 82, 100, 52, 64, 84, 130, 104, 48, 63, 83, 103, 30, 20,…
skim(pokemon)
Data summary
Name pokemon
Number of rows 800
Number of columns 5
_______________________
Column type frequency:
character 1
list 1
numeric 3
________________________
Group variables None

Variable type: character

skim_variable n_missing complete_rate min max empty n_unique whitespace
name 0 1 3 25 0 800 0

Variable type: list

skim_variable n_missing complete_rate n_unique min_length max_length
type 0 1 154 1 2

Variable type: numeric

skim_variable n_missing complete_rate mean sd p0 p25 p50 p75 p100 hist
total 0 1 435.10 119.96 180 330 450 515 780 ▃▆▇▂▁
hp 0 1 69.26 25.53 1 50 65 80 255 ▃▇▁▁▁
attack 0 1 79.00 32.46 5 55 75 100 190 ▂▇▆▂▁
inspect(pokemon)
List of 800
 $ : chr [1:2] "Grass" "Poison"
 $ : chr [1:2] "Grass" "Poison"
 $ : chr [1:2] "Grass" "Poison"
 $ : chr [1:2] "Grass" "Poison"
 $ : chr "Fire"
 $ : chr "Fire"
 $ : chr [1:2] "Fire" "Flying"
 $ : chr [1:2] "Fire" "Dragon"
 $ : chr [1:2] "Fire" "Flying"
 $ : chr "Water"
 $ : chr "Water"
 $ : chr "Water"
 $ : chr "Water"
 $ : chr "Bug"
 $ : chr "Bug"
 $ : chr [1:2] "Bug" "Flying"
 $ : chr [1:2] "Bug" "Poison"
 $ : chr [1:2] "Bug" "Poison"
 $ : chr [1:2] "Bug" "Poison"
 $ : chr [1:2] "Bug" "Poison"
 $ : chr [1:2] "Normal" "Flying"
 $ : chr [1:2] "Normal" "Flying"
 $ : chr [1:2] "Normal" "Flying"
 $ : chr [1:2] "Normal" "Flying"
 $ : chr "Normal"
 $ : chr "Normal"
 $ : chr [1:2] "Normal" "Flying"
 $ : chr [1:2] "Normal" "Flying"
 $ : chr "Poison"
 $ : chr "Poison"
 $ : chr "Electric"
 $ : chr "Electric"
 $ : chr "Ground"
 $ : chr "Ground"
 $ : chr "Poison"
 $ : chr "Poison"
 $ : chr [1:2] "Poison" "Ground"
 $ : chr "Poison"
 $ : chr "Poison"
 $ : chr [1:2] "Poison" "Ground"
 $ : chr "Fairy"
 $ : chr "Fairy"
 $ : chr "Fire"
 $ : chr "Fire"
 $ : chr [1:2] "Normal" "Fairy"
 $ : chr [1:2] "Normal" "Fairy"
 $ : chr [1:2] "Poison" "Flying"
 $ : chr [1:2] "Poison" "Flying"
 $ : chr [1:2] "Grass" "Poison"
 $ : chr [1:2] "Grass" "Poison"
 $ : chr [1:2] "Grass" "Poison"
 $ : chr [1:2] "Bug" "Grass"
 $ : chr [1:2] "Bug" "Grass"
 $ : chr [1:2] "Bug" "Poison"
 $ : chr [1:2] "Bug" "Poison"
 $ : chr "Ground"
 $ : chr "Ground"
 $ : chr "Normal"
 $ : chr "Normal"
 $ : chr "Water"
 $ : chr "Water"
 $ : chr "Fighting"
 $ : chr "Fighting"
 $ : chr "Fire"
 $ : chr "Fire"
 $ : chr "Water"
 $ : chr "Water"
 $ : chr [1:2] "Water" "Fighting"
 $ : chr "Psychic"
 $ : chr "Psychic"
 $ : chr "Psychic"
 $ : chr "Psychic"
 $ : chr "Fighting"
 $ : chr "Fighting"
 $ : chr "Fighting"
 $ : chr [1:2] "Grass" "Poison"
 $ : chr [1:2] "Grass" "Poison"
 $ : chr [1:2] "Grass" "Poison"
 $ : chr [1:2] "Water" "Poison"
 $ : chr [1:2] "Water" "Poison"
 $ : chr [1:2] "Rock" "Ground"
 $ : chr [1:2] "Rock" "Ground"
 $ : chr [1:2] "Rock" "Ground"
 $ : chr "Fire"
 $ : chr "Fire"
 $ : chr [1:2] "Water" "Psychic"
 $ : chr [1:2] "Water" "Psychic"
 $ : chr [1:2] "Water" "Psychic"
 $ : chr [1:2] "Electric" "Steel"
 $ : chr [1:2] "Electric" "Steel"
 $ : chr [1:2] "Normal" "Flying"
 $ : chr [1:2] "Normal" "Flying"
 $ : chr [1:2] "Normal" "Flying"
 $ : chr "Water"
 $ : chr [1:2] "Water" "Ice"
 $ : chr "Poison"
 $ : chr "Poison"
 $ : chr "Water"
 $ : chr [1:2] "Water" "Ice"
  [list output truncated]

 variables:  
data frame with 0 columns and 0 rows

categorical variables:  
  name     class levels   n missing
1 name character    800 800       0
                                   distribution
1 Abomasnow (0.1%) ...                         

quantitative variables:  
    name   class min  Q1 median  Q3 max      mean        sd   n missing
1  total integer 180 330    450 515 780 435.10250 119.96304 800       0
2     hp integer   1  50     65  80 255  69.25875  25.53467 800       0
3 attack integer   5  55     75 100 190  79.00125  32.45737 800       0

Data munging & Data Dictionary

  • tried converting list into factor, could not.

  • leaving type as it is.

  Variable_Name Data_Type
1          Name character
2          Type    factor
3            HP   integer
4        Attack   integer
5         Total   integer
                                                             Description
1                                               The name of the Pokémon.
2 The type(s) of the Pokémon, affecting battle strengths and weaknesses.
3                   Total health of the Pokémon in battles (Hit Points).
4                                 Damage dealt by the Pokémon's attacks.
5                                                      Total HP overall.

Questions

pokemon_summary <- pokemon %>%
group_by(type) %>%
summarize(avg_hp = mean(hp), avg_attack = mean(attack))

pokemon_summary
# A tibble: 154 × 3
   type      avg_hp avg_attack
   <list>     <dbl>      <dbl>
 1 <chr [2]>   64.9       70.5
 2 <chr [1]>   62.7       78.4
 3 <chr [2]>   82         95.3
 4 <chr [2]>   78        130  
 5 <chr [1]>   66.8       71.8
 6 <chr [1]>   53.1       50.4
 7 <chr [2]>   63         70.1
 8 <chr [2]>   53.8       68.3
 9 <chr [2]>   62.0       73.0
10 <chr [1]>   81.1       73.8
# ℹ 144 more rows

average hp and attack for each type

Abandoning this data set as list needs to be converted into factor to get accurate data viz. 

Fertility DataSet

fertility<- read_delim("../../data/Fertility.csv")
Rows: 254654 Columns: 9
── Column specification ────────────────────────────────────────────────────────
Delimiter: ","
chr (6): morekids, gender1, gender2, afam, hispanic, other
dbl (3): rownames, age, work

ℹ Use `spec()` to retrieve the full column specification for this data.
ℹ Specify the column types or set `show_col_types = FALSE` to quiet this message.
print(head(fertility))
# A tibble: 6 × 9
  rownames morekids gender1 gender2   age afam  hispanic other  work
     <dbl> <chr>    <chr>   <chr>   <dbl> <chr> <chr>    <chr> <dbl>
1        1 no       male    female     27 no    no       no        0
2        2 no       female  male       30 no    no       no       30
3        3 no       male    female     27 no    no       no        0
4        4 no       male    female     35 yes   no       no        0
5        5 no       female  female     30 no    no       no       22
6        6 no       male    female     26 no    no       no       40

Examining

glimpse(fertility)
Rows: 254,654
Columns: 9
$ rownames <dbl> 1, 2, 3, 4, 5, 6, 7, 8, 9, 10, 11, 12, 13, 14, 15, 16, 17, 18…
$ morekids <chr> "no", "no", "no", "no", "no", "no", "no", "no", "no", "no", "…
$ gender1  <chr> "male", "female", "male", "male", "female", "male", "female",…
$ gender2  <chr> "female", "male", "female", "female", "female", "female", "ma…
$ age      <dbl> 27, 30, 27, 35, 30, 26, 29, 33, 29, 27, 28, 28, 35, 34, 32, 2…
$ afam     <chr> "no", "no", "no", "yes", "no", "no", "no", "no", "no", "no", …
$ hispanic <chr> "no", "no", "no", "no", "no", "no", "no", "no", "no", "no", "…
$ other    <chr> "no", "no", "no", "no", "no", "no", "no", "no", "no", "no", "…
$ work     <dbl> 0, 30, 0, 0, 22, 40, 0, 52, 0, 0, 0, 52, 52, 52, 8, 7, 0, 40,…
skim(fertility)
Data summary
Name fertility
Number of rows 254654
Number of columns 9
_______________________
Column type frequency:
character 6
numeric 3
________________________
Group variables None

Variable type: character

skim_variable n_missing complete_rate min max empty n_unique whitespace
morekids 0 1 2 3 0 2 0
gender1 0 1 4 6 0 2 0
gender2 0 1 4 6 0 2 0
afam 0 1 2 3 0 2 0
hispanic 0 1 2 3 0 2 0
other 0 1 2 3 0 2 0

Variable type: numeric

skim_variable n_missing complete_rate mean sd p0 p25 p50 p75 p100 hist
rownames 0 1 127327.50 73512.42 1 63664.25 127327.5 190990.8 254654 ▇▇▇▇▇
age 0 1 30.39 3.39 21 28.00 31.0 33.0 35 ▁▃▅▇▇
work 0 1 19.02 21.87 0 0.00 5.0 44.0 52 ▇▁▁▁▃
inspect(fertility)

categorical variables:  
      name     class levels      n missing
1 morekids character      2 254654       0
2  gender1 character      2 254654       0
3  gender2 character      2 254654       0
4     afam character      2 254654       0
5 hispanic character      2 254654       0
6    other character      2 254654       0
                                   distribution
1 no (61.9%), yes (38.1%)                      
2 male (51.4%), female (48.6%)                 
3 male (51.3%), female (48.7%)                 
4 no (94.8%), yes (5.2%)                       
5 no (92.6%), yes (7.4%)                       
6 no (94.4%), yes (5.6%)                       

quantitative variables:  
      name   class min       Q1   median       Q3    max         mean
1 rownames numeric   1 63664.25 127327.5 190990.8 254654 127327.50000
2      age numeric  21    28.00     31.0     33.0     35     30.39327
3     work numeric   0     0.00      5.0     44.0     52     19.01833
            sd      n missing
1 73512.422063 254654       0
2     3.386447 254654       0
3    21.867277 254654       0

Data Munging and Dictionary

  Variable_Name Data_Type                              Description
1      morekids    factor do the respondents have more than 2 kids
2       gender1    factor                gender of the first child
3       gender2    factor               gender of the second child
4      hispanic    factor                        are they hispanic
5           age   integer                                      age
fertility_modified <- fertility %>%
mutate(
    morekids= as.factor(morekids),  
    gender1 = as.factor(gender1),
    gender2 = as.factor(gender2),
    hispanic = as.factor(hispanic),
    other = as.factor(other),
    
  )
glimpse(fertility_modified)
Rows: 254,654
Columns: 9
$ rownames <dbl> 1, 2, 3, 4, 5, 6, 7, 8, 9, 10, 11, 12, 13, 14, 15, 16, 17, 18…
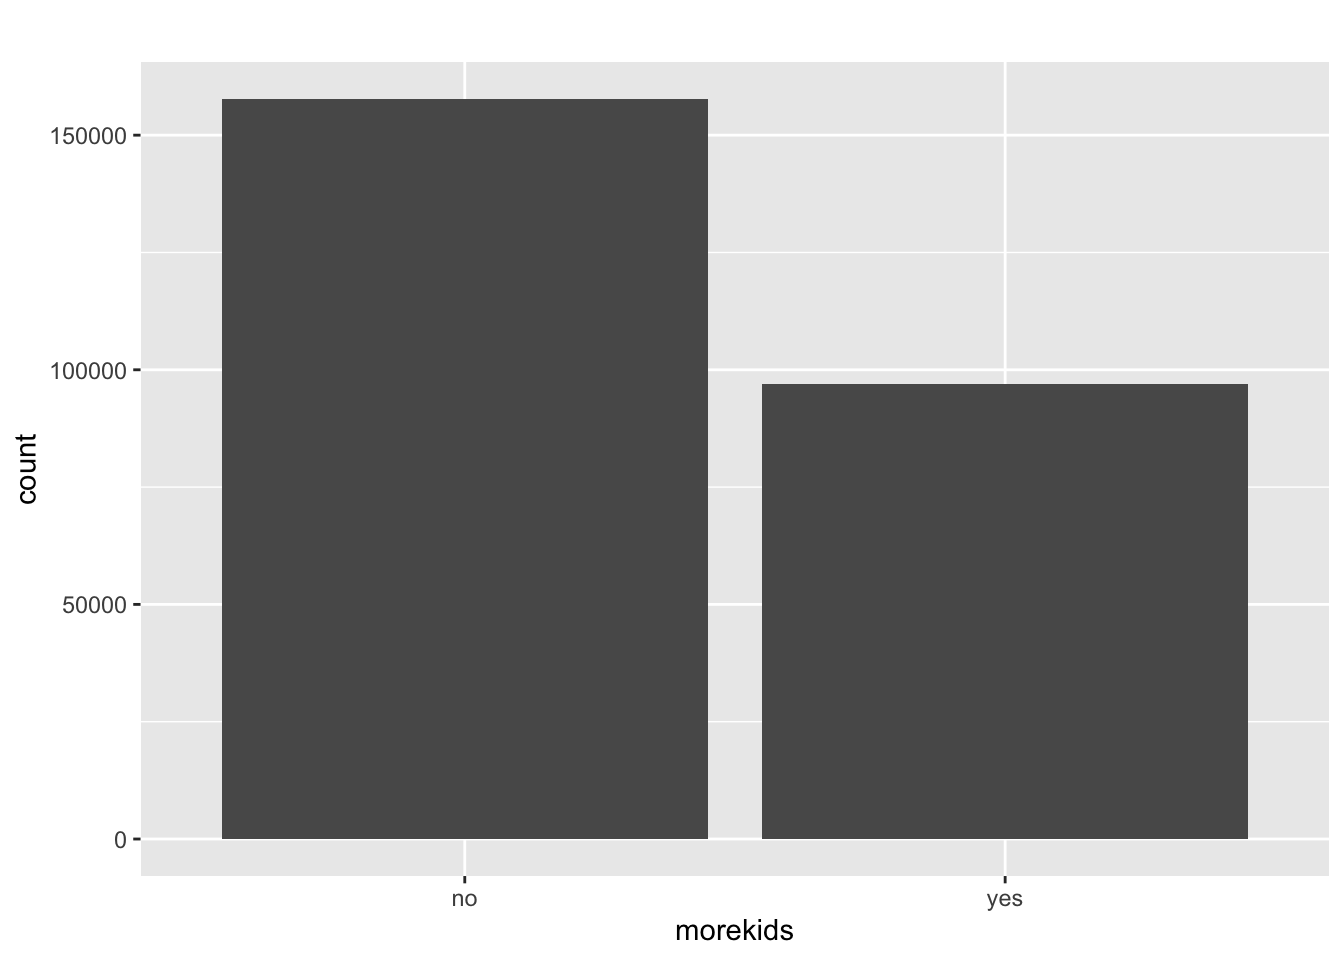
$ morekids <fct> no, no, no, no, no, no, no, no, no, no, yes, no, no, no, no, …
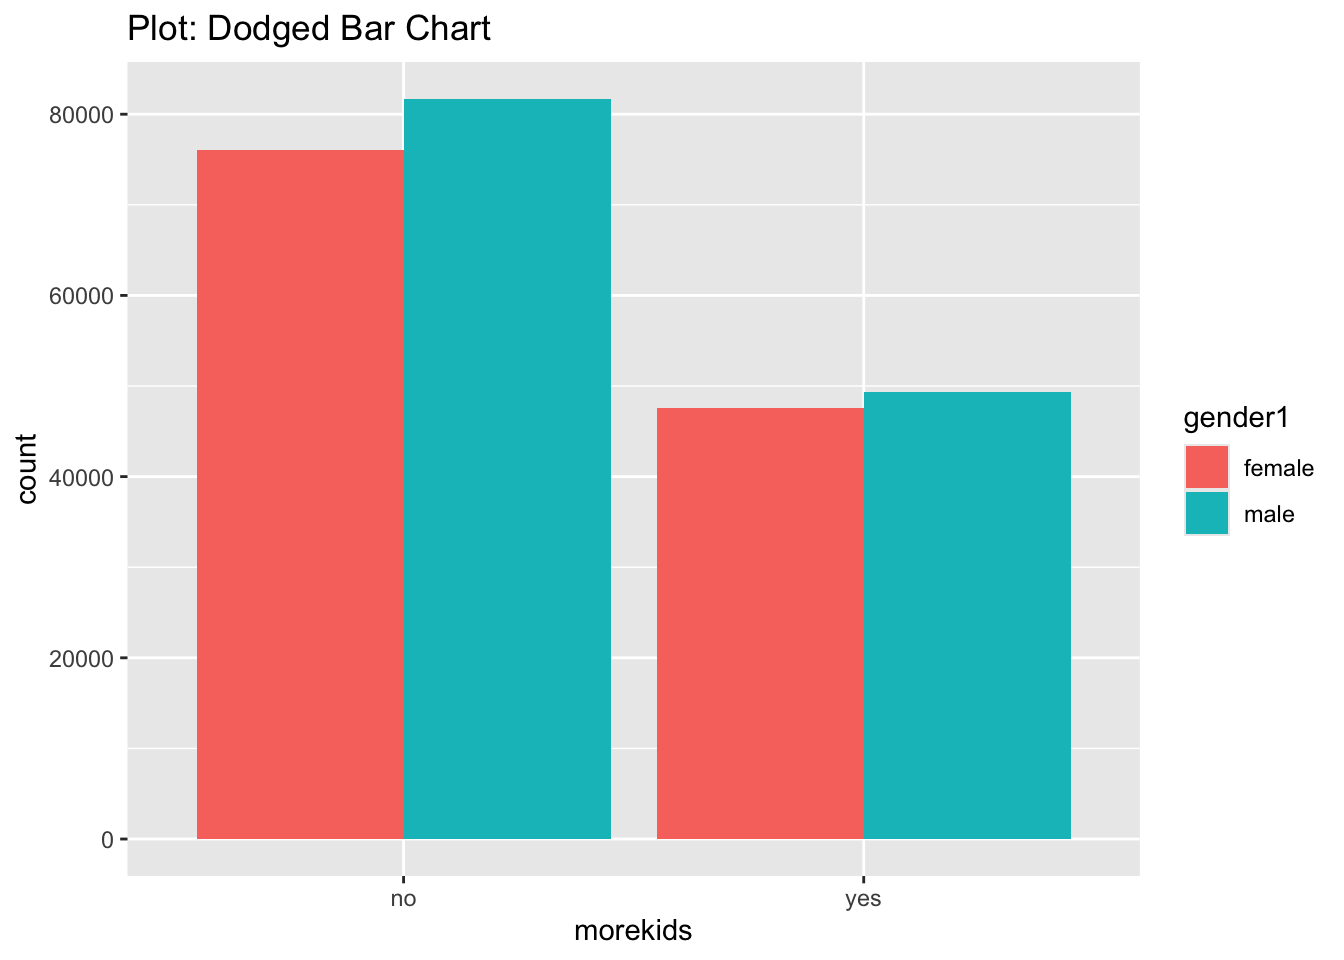
$ gender1  <fct> male, female, male, male, female, male, female, male, female,…
$ gender2  <fct> female, male, female, female, female, female, male, male, mal…
$ age      <dbl> 27, 30, 27, 35, 30, 26, 29, 33, 29, 27, 28, 28, 35, 34, 32, 2…
$ afam     <chr> "no", "no", "no", "yes", "no", "no", "no", "no", "no", "no", …
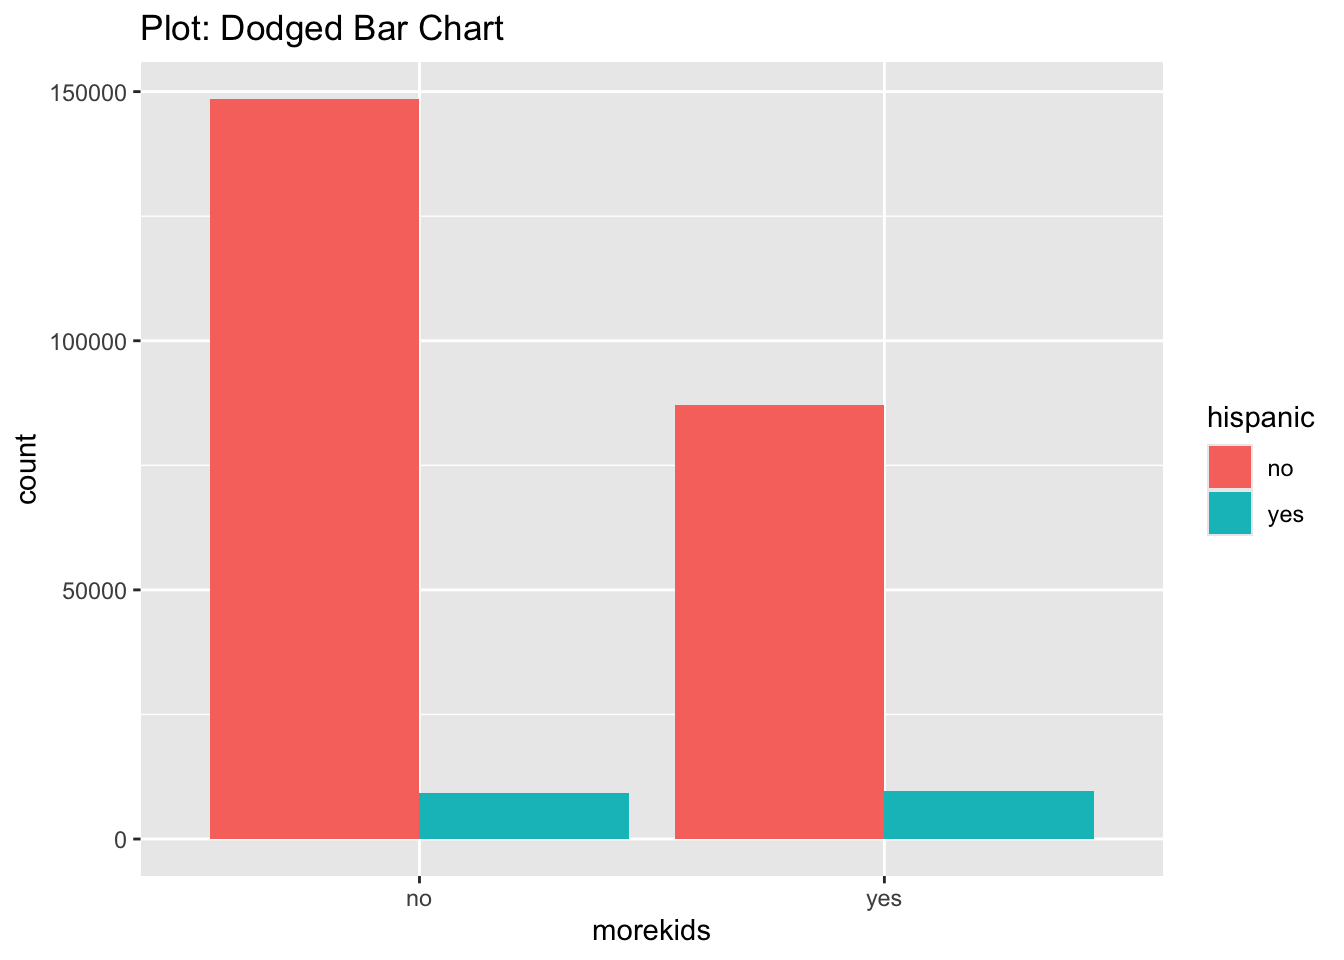
$ hispanic <fct> no, no, no, no, no, no, no, no, no, no, no, no, no, no, no, n…
$ other    <fct> no, no, no, no, no, no, no, no, no, no, no, no, no, no, no, n…
$ work     <dbl> 0, 30, 0, 0, 22, 40, 0, 52, 0, 0, 0, 52, 52, 52, 8, 7, 0, 40,…

Bar graphs

gf_bar(~morekids, data = fertility_modified) %>%
  gf_labs(title = "")

  • Does the Hispanic ethnic group tend to have a higher number of children?

    fertility_modified %>%
      gf_bar(~morekids, 
             fill = ~hispanic, 
             position = "dodge") %>%
    
      gf_labs(title = "Plot: Dodged Bar Chart")

Inferences

  • majority, regardless of their ethnicity, indicate they do not have more kids.

  • vast majority of hispanic respondents seem to not have more kids.

fertility_modified %>%
  gf_bar(~morekids, 
         fill = ~gender1, 
         position = "dodge") %>%
  
  gf_labs(title = "Plot: Dodged Bar Chart")

Inference

  • people with male kids as their firstborn prefer to not have more kids.