── Attaching core tidyverse packages ──────────────────────── tidyverse 2.0.0 ──
✔ dplyr     1.1.4     ✔ readr     2.1.5
✔ forcats   1.0.0     ✔ stringr   1.5.1
✔ ggplot2   3.5.1     ✔ tibble    3.2.1
✔ lubridate 1.9.3     ✔ tidyr     1.3.1
✔ purrr     1.0.2
── Conflicts ────────────────────────────────────────── tidyverse_conflicts() ──
✖ dplyr::filter() masks stats::filter()
✖ dplyr::lag()    masks stats::lag()
ℹ Use the conflicted package (<http://conflicted.r-lib.org/>) to force all conflicts to become errors
library(mosaic)
Registered S3 method overwritten by 'mosaic':
  method                           from
  fortify.SpatialPolygonsDataFrame ggplot2

The 'mosaic' package masks several functions from core packages in order to add
additional features.  The original behavior of these functions should not be affected by this.

Attaching package: 'mosaic'

The following object is masked from 'package:Matrix':

    mean

The following objects are masked from 'package:dplyr':

    count, do, tally

The following object is masked from 'package:purrr':

    cross

The following object is masked from 'package:ggplot2':

    stat

The following objects are masked from 'package:stats':

    binom.test, cor, cor.test, cov, fivenum, IQR, median, prop.test,
    quantile, sd, t.test, var

The following objects are masked from 'package:base':

    max, mean, min, prod, range, sample, sum
library(ggformula)library(infer)
Attaching package: 'infer'

The following objects are masked from 'package:mosaic':

    prop_test, t_test
library(broom) # Clean test results in tibble formlibrary(resampledata) # Datasets from Chihara and Hesterberg's book
Attaching package: 'resampledata'

The following object is masked from 'package:datasets':

    Titanic
library(openintro) # More datasets
Loading required package: airports
Loading required package: cherryblossom
Loading required package: usdata

Attaching package: 'openintro'

The following object is masked from 'package:mosaic':

    dotPlot

The following objects are masked from 'package:lattice':

    ethanol, lsegments
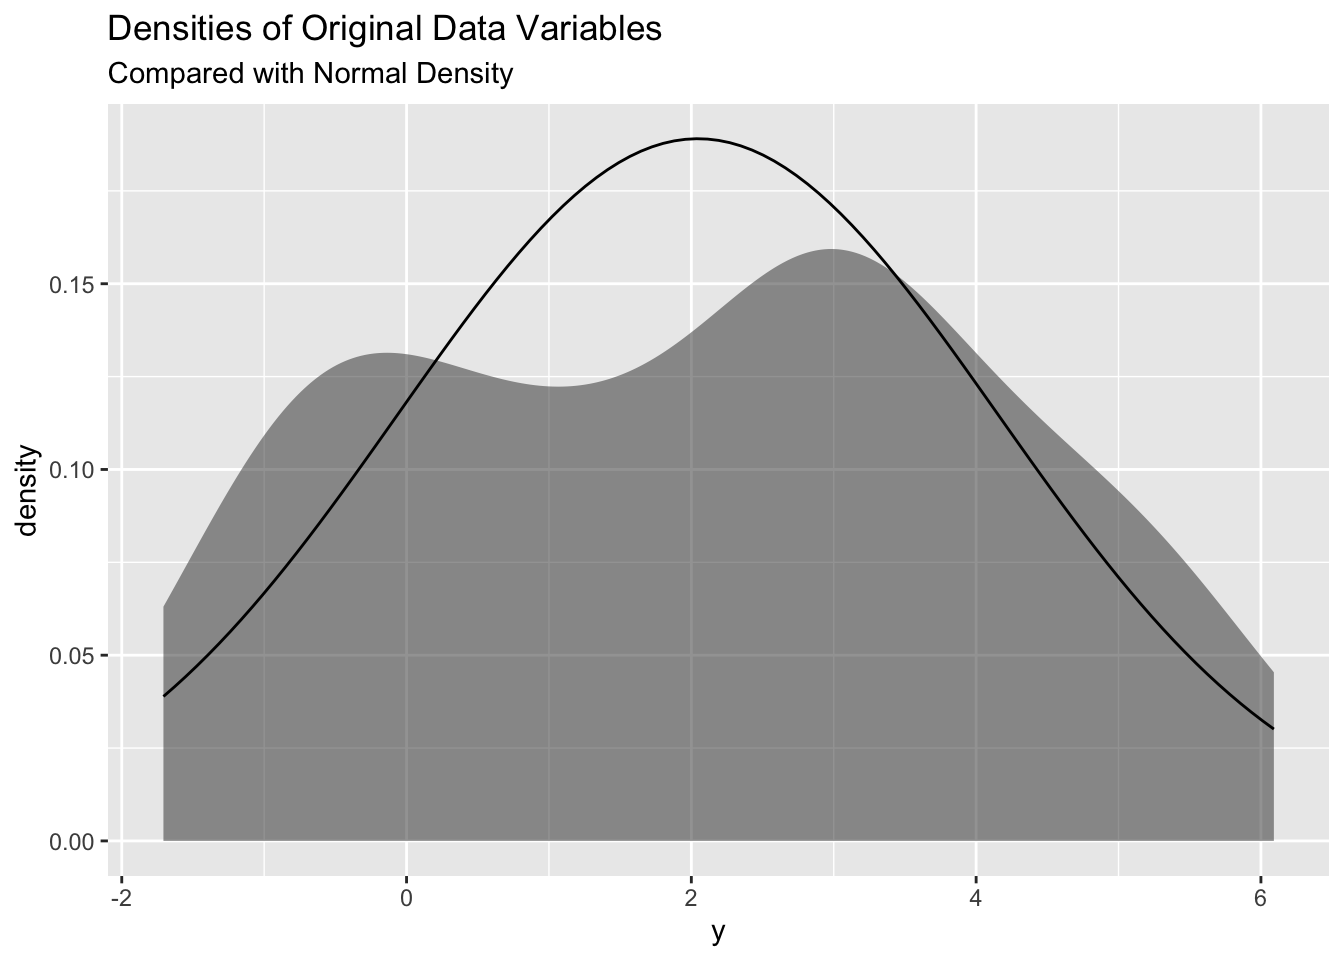
set.seed(40) # for replication# Data as individual vectors ( for t.tests etc)y <-rnorm(50, mean =2, sd =2)# And as tibble toomydata <-tibble(y = y)mydata
##so we have vector(array?) y with 50 normally distributed random numbers - data is symetrically distribted around the mean
mydata %>%gf_density(~y) %>%##distribution of y values gf_fitdistr(dist ="dnorm") %>%##normal distribution based on mean and sd? always a symmetrical bell curve gf_labs(title ="Densities of Original Data Variables", subtitle ="Compared with Normal Density")
# t-testt1 <- mosaic::t_test( y, # Name of variablemu =0, # belief of population meanalternative ="two.sided") %>%# Check both sides broom::tidy() # Make results presentable, and plottable!!t1